A Closer Look at SVG Path Data
SVG paths represent the outline of a shape. This shape can be filled, stroked, used to navigate text, become a pattern, and/or used as a clipping path.
When we write SVG by hand in our HTML or embed the XML code from vector graphic software, the code details of the paths that make up our graphics are exposed. This way of utilizing SVG is referred to as “inline” and this handy post over at CSS-Tricks should help get you started on that and other SVG concepts.
Depending on the shapes used, these paths can get fairly complex, especially when there are many curves involved. Understanding what exactly is going on “behind the scenes” here can be really beneficial in terms of editing these graphics and eliminating any surprises when they are rendered.
In this article, I’ll review the possible commands that reside within the path data of SVG, with a special focus on an image of a banana and a number of diagrams for further understanding.
The path Element
The <path> element within <svg> contains the command details that a path takes to complete a shape, which can consist of both straight lines and curves.
While the <path> element accepts a number of attributes, in this article I’ll strictly focus on the commands within the path data.
Path Data
The path data makes up the specific information that defines a graphic’s path. This data can include a start and end point, subpaths, and curves through moveto, lineto, closepath, and various curve commands.
This data is contained within a d attribute in the <path> element:
<svg>
    <path d="<path data details>" />
</svg>
Let’s take a look at a banana graphic. This banana consists of two <path> elements, each containing a start point and at least one curve command.
<svg width="228px" height="253px" viewBox="0 0 228 253">
    <g class="banana">
        <path fill="none" stroke="#f7c562" stroke-width="8" stroke-linecap="round" stroke-linejoin="round" d="M8.64,223.948c0,0,143.468,3.431,185.777-181.808c2.673-11.702-1.23-20.154,1.316-33.146h16.287c0,0-3.14,17.248,1.095,30.848
  c21.392,68.692-4.179,242.343-204.227,196.59L8.64,223.948z" />
        <path fill="none" stroke="#f7c562" stroke-width="8" stroke-linecap="round" stroke-linejoin="round" d="M8.767,230.326c0,0,188.246,40.154,196.485-160.139" />
    </g>
</svg>
See the Pen SVG banana demonstrating path data syntax by SitePoint (@SitePoint) on CodePen.
The first <path> comprises the outer closed outline of the banana while the second <path> makes up the inner unclosed line.
The moveto Command
The moveto commands (M or m) establish a new point, as lifting a pen and starting to draw in a new location on paper would. The line of code making up the path data must begin with a moveto command, as shown in the above example of the banana. moveto commands that follow the initial one represent the start of a new subpath.
An uppercase M here indicates absolute coordinates will follow, while a lowercase m indicates relative coordinates. So while these two may initially appear as if they would produce identical graphics, the difference between them is quite dramatic in terms of how our paths are mapped onto the canvas.
If this command is followed by multiple pairs of coordinates, these coordinates that follow are treated as lineto commands (discussed further in the next section), drawing a straight line. These assumed lineto commands will be relative if the moveto is relative, and absolute if the moveto is absolute.
If the first element begins with a relative moveto (m) path then those pairs of coordinates are treated as absolute ones and pairs of coordinates to follow are treated as relative.
lineto
The lineto commands draw straight lines from the current point to a new point.
L, l
The L and l commands draw a line from a start point to the end point. Each time a line is drawn to a specified point, this point becomes the “current point” until the path drawing is complete. The end point becomes the final “current point”, just as would be the case when actually drawing.
An uppercase L signals that absolute coordinates will follow, while a lowercase l signals relative coordinates.
H, h
The H and h commands draw a horizontal line from the current point. An uppercase H signals that absolute positioning will follow, while a lowercase h signals relative.
V, v
The V and v commands draw a vertical line from the current point. An uppercase V signals that absolute positioning will follow, while a lowercase v is relative.
closepath
The closepath (Z or z) ends the current subpath and results in a straight line being drawn from that point to the initial point of the path.
If the closepath is followed immediately by a moveto, these moveto coordinates represent the start of the next subpath. If this same closepath is followed by anything other than moveto, the next subpath begins at the same point as the current (or last active) subpath.
If we closed the second <path> of the banana, a line would be drawn connecting the start and end points of the path.
See the Pen sofet by SitePoint (@SitePoint) on CodePen.
Both uppercase or lowercase z here have identical outcomes.
Curve Commands
There are three groups of commands that draw curved paths: Cubic Bézier (C, c, S, s), Quadratic Bézier (Q, q, T, t), and Elliptical arc (A, a).
As with most of the commands we have reviewed thus far, the use of uppercase or lowercase commands has a significant impact on the graphic. For example, the demo of the banana above contains several relatively positioned curve commands, “c”.
Changing one of these commands to “C” establishes this curve in absolute space, having a tragic effect on the rendered shape as shown with the second banana (or what was once a banana) below.
See the Pen SVG banana demonstrating relative curve positioning by SitePoint (@SitePoint) on CodePen.
The following curve sections will introduce the basic concept behind each curve command, review the mapping details, and then provide a diagram for further understanding.
Cubic Bézier
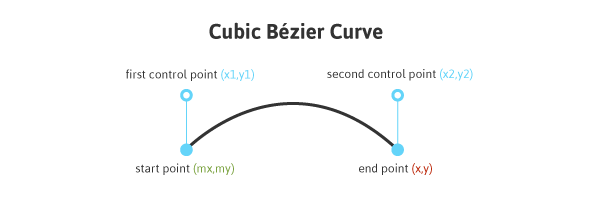
The C and c Cubic Bézier commands draw a curve from the initial point using (x1,y1) parameters as a control point at the beginning of the curve and (x2,y2) as the control point at the end, defining the shape details of the curve.
The code below draws a basic Cubic Bézier curve:
<svg>
    <path fill="none"
          stroke="#333333"
          stroke-width="3"
          d="M10,55 C15,5 100,5 100,55" />
</svg>
Manipulating the first and last sets of values for this curve will impact its start and end location, while manipulating the two center sets of values will impact the shape and positioning of the curve itself at the beginning and end.
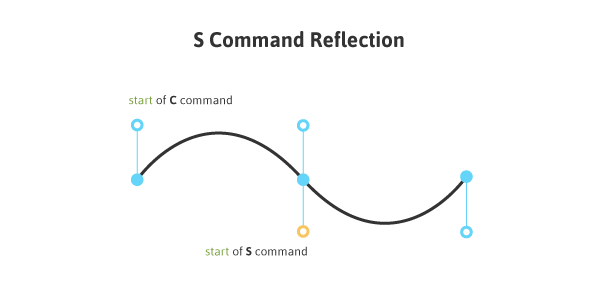
The S and s commands also draw a Cubic Bézier curve, but in this instance there is an assumption that the first control point is a reflection of the last control point for the previous C command. This reflection is relative to the start point of the S command.
Quadratic Bézier
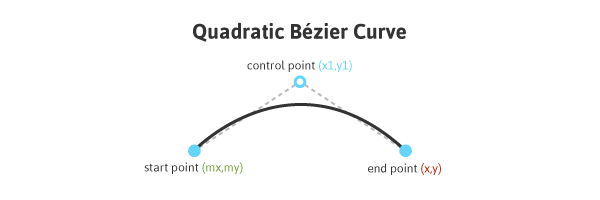
Quadratic Bézier curves (Q, q, T, t) are similar to Cubic Bézier curves except that they have only one control point.
The following code draws a basic Quadratic Bézier curve:
<svg>
    <path fill="none"
          stroke="#333333"
          stroke-width="3"
          d="M20,50 Q40,5 100,50" />
</svg>
Manipulating the first and last sets of values, M20,50 and 100,50, impacts the positioning of the beginning and end points of the curve. The center set of values, Q40,5, define the control point for the curve, establishing its shape.
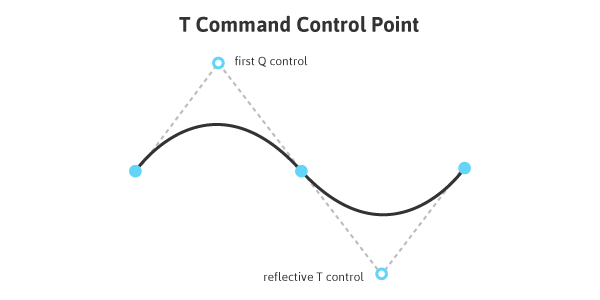
Q and q draw the curve from the initial point to the end point using (x1,y1) as the control. T and t draw the curve from the initial point to the end point by assuming that the control point is a reflection of the control on the previously listed command relative to the start point of the new T or t command.
An uppercase Q signals that absolute positioning will follow, while a lowercase q is relative. This same logic applies to T and t.
Elliptical Arc
An Elliptical Arc (A, a) defines a segment of an ellipse. These segments are created through the A or a commands which create the arc by specifying the start point, end point, x and y radii, rotation, and direction.
Here is a look at the code for a basic Elliptical Arc:
<svg>
    <path fill="none"
          stroke="#333333"
          stroke-width="3"
          d="M65,10 a50,25 0 1,0 50,25" />
</svg>
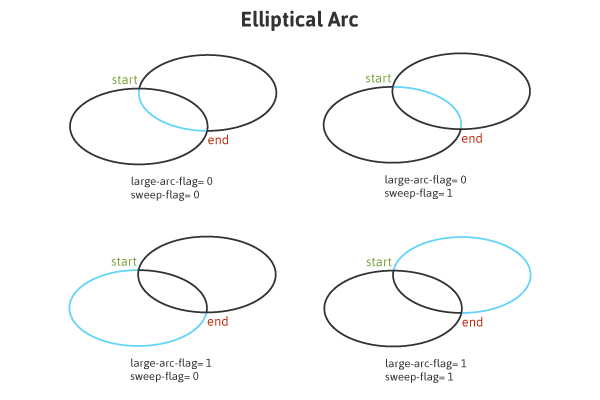
The first and last sets of values within this path, M65,10 and 50,25, represent initial and final coordinates, while the second set of values define the two radii. The values of 1,0 (large-arc-flag and sweep-flag) determine how the arc is drawn, as there are four different options here.
The following diagram shows the four arc options and the impact that large-arc-flag and sweep-flag values have on the final rendering of the arc segment.
A Note on Optimization
When including embeds from vector graphic software it is often encouraged to first run this code through an SVG optimizer, such as SVGO or the one developed by Peter Collingridge. The content of a path’s data is often where this graphic can be cleaned up and optimized the most, greatly reducing the file’s size in most cases.
The file size for our banana graphic was reduced to 65.9% of the original file after being run through an optimizer. Here is a look at the new reduced code:
<svg width="228" height="253" viewBox="0 0 228 253">
    <g class="banana"><path fill="none" stroke="#f7c562" stroke-width="8" stroke-linecap="round" stroke-linejoin="round" d="M8.6 223.9c0 0 143.5 3.4 185.8-181.8 2.7-11.7-1.2-20.2 1.3-33.1h16.3c0 0-3.1 17.2 1.1 30.8 21.4 68.7-4.2 242.3-204.2 196.6L8.6 223.9zM8.8 230.3c0 0 188.2 40.2 196.5-160.1" />
    </g>
</svg>
Conclusion
The data within a <path> element can make up the longest and most complex details of an SVG, but dissecting and understanding what exactly is going on within this string of code can really help to better understand the workings of your SVG and aid in the effortless editing and manipulation of these paths.
I hope this article has given you an overview of the basic function of the <path> element and the impact that various command options will have on the final shape that is rendered, potentially making this code less intimidating to work with.
Joni Trythall is a modest and slightly confused creator of web sundries living in always sunny Seattle, WA. She mainly writes about the creation of adorable things on the web and is author of Pocket Guide to Writing SVG. You can find her code ramblings at jonibologna.com or @jonitrythall.

Free book: Jump Start HTML5 Basics
Grab a free copy of one our latest ebooks! Packed with hints and tips on HTML5's most powerful new features.
-
Sarbjit Singh
-
http://alexplaza.co Alex Plaza Cancino