Increasing an NPM package’s search score
npmjs.com search results use a scoring algorithm which takes into account package quality and maintenance. As a package maintainer, you can easily increase the quality score and achieve better visibility for your package in the search results.

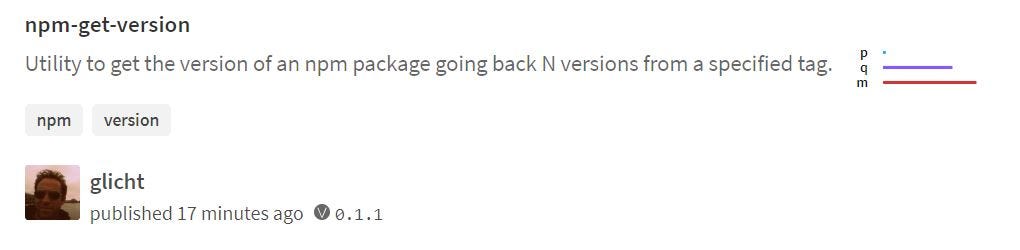
If you’ve ever done a search on npmjs.com, you’ve probably noticed in the right side a small bar graph. The bar graph has three indicators: p (popularity), q (quality) and m (maintenance). Each represents a score and a weighted average aggregate is used to calculate a final score. Where the weights used are quality: 0.3, maintenance: 0.35 and popularity: 0.35. The score and key words affect how a package is placed in the search results. Meaning, a higher score can place the package higher up in the results.
The search is actually powered by npms.io and if you perform the search there, you will get some more detailed info regarding the bar graph, final score and also indications if a package is secure or not. npms.io have some information about how scores are calculated on their site. Although, that info is quite general. What’s nice is that they’ve also open-sourced the analyzer they use for calculating scores and it is possible to dig deeper if one wants to better understand how the scoring is actually done. For example, the weights used in calculating the final score (0.3, 0.35, 0.35) can be seen here. Additionally, it is possible to get a detailed analysis (JSON) of the a score by accessing npms.io api: https://api.npms.io/v2/package/<package-name> .
If you want to increase the final score of your package the easiest sections to focus on are quality and maintenance, as these sections are fully in your control. The popularity section is mostly dependent upon downloads and github stars, so I won’t go into this.
Maintenance Score
From my experience it is pretty straight forward to reach a high score in the maintenance area, especially during the initial development cycle of a package. A package which is actively being maintained and developed shouldn’t have a problem of obtaining a score close to 100%. I’ll detail here how the sub-scores of the maintenance score are calculated for better understanding, in case you are experiencing a low score. The maintenance score consists of 4 sub-scores:
Release Frequency: this score is calculated according to the number of releases in a quarter. It does take into account releases going back up to 2 years. To keep it short, if you are averaging 2 releases a quarter or more then you will get a full score on this.
Commits Frequency: this score is calculated according to the number of monthly commits. It takes into account commits going back up to 1 year. To keep it short, if you are averaging 5 monthly commits you will score a 0.9 and if above 10 you will get a full score.
Open Issues: this score is based upon the ratio between open issues and total issues. If the ration is less than 0.2 you will get a full score. Note that if the project has no issues it will get an automatic score of 0.7.
Issue Distribution: this score takes into account the mean open days of the project’s issues. It gives an extra normalized weight if issues are open over 29 days up to a 5 times increase for issues open a year or more. To keep things simple, if you can maintain a mean time of open issues of 5 days or below you will get a full score. If you maintain a mean of 30 days then the score will be 0.7. Note that if the project has no issues it will get an automatic score of 0.7.
Finally, the scoring algorithm takes into account a project which is “finished”. In this case each sub-score will get a minimum of 0.9. A “finished” project is defined as one that has a version equal or above 1.0.0, not deprecated, has less than 15 open issues, has a readme and has tests. If you want to view the code that does the maintenance scoring it is available here.
Quality Score
The quality score can be a bit complex when trying to understand all of it’s elements. The code that calculates the quality score is available here. The score is divided into 4 sub-scores:
Health Score: the health score is influenced by the number of outdated dependencies and if any vulnerabilities exist for the package. If all dependencies are up to date and there are no known vulnerabilities, the package receives a full score, as is the case with my example package. Keeping dependencies up to date and resolving vulnerabilities is obviously best practice and if done it should be straight forward to receive full score on this.
Carefulness: the carefulness score is evaluated according to the presence of the following elements in the package (with weight for each element): license (0.33), readme (0.38), change log (0.08), use of linters (0.13), and the package has either an npm ignore section or explicit file includes (0.08). But, this is not all. The score then takes into account if the package is considered “stable”. Where “stable” means a version greater or equal to 1.0.0. If the package is not “stable” the score is cut by half. So even if you have all elements specified above and your package version is 0.x.x then the max score you can get in this section is 0.5. Many times a package’s version stays on 0.x.x version, even though it is production ready. If this is the case, consider moving the version to 1.x.x as it will double the score of this section.
Tests score: the tests score is evaluated according to three parameters: the presence of test files (0.6), coverage (0.15) and Github statuses (0.25). For test files it is not enough to simply have unit tests. There is a need to also have an npm “test” script in package.json file and the test files need to be larger than 400 bytes to get the full 0.6 score. Coverage is calculated relative to the reported coverage of the project and there is need to hook up the project to a code coverage reporting framework such as coveralls.io. Statuses are obtained from Github’s api and checked that each category has at least one success. The Github statuses api can be queried by accessing: https://api.github.com/repos/:owner/:repo/commits/master/statuses.
Branding: the branding score is calculated according to two parameters: project homepage (0.4), and number of badges the project has on its README (0.6). The homepage needs to be outside of the github.com domain (for example babeljs.io). For the badges it is enough to have 4 or more to get the full 0.6 score.
Example Package
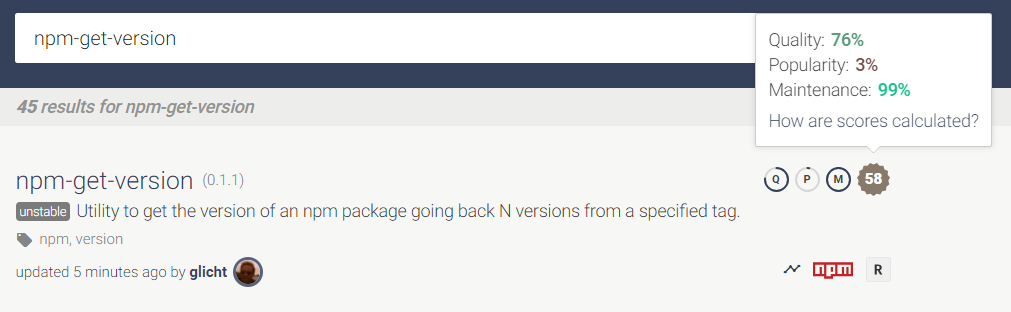
In the rest of this post I’ll walk through the steps I took to increase the quality score of a small utility package I maintain: npm-get-version (motivation for this package is subject for another post). The starting quality score for this package was: 76%. I didn’t really like this score (who wants to receive a 76% for quality?), so I set out to increase the score and after a few simple steps I was able to increase the score to 100%.
I started by obtaining the quality sub-scores for this package. This is available from npms.io api: https://api.npms.io/v2/package/npm-get-version :
{"carefulness":0.49999999999999994,"tests":0.6,"health":1,"branding":0}Health score was a full 1 at the starting point, as the package had all its dependencies up to date and no vulnerabilities.
First up, I approached the “tests” score. The score was at 0.6 as I had unit tests in place. I also had local coverage reporting, but was missing online coverage reports and Github statuses for my project. The way to improve this was to add the project to a continues integration system (Travis-CI) and an online coverage reporting tool (coveralls.io). I added a simple .travis.yml file (less than 10 lines) and had my build and coverage in place. Added bonus: Travis is now testing my package on node 6, 8 and 10 (something I wasn’t doing locally). After this update, the “tests “ score was now at a full 1 and the quality score has increased by 6% to 82%.
Important note: npms.io will analyze the package very shortly after the package is published. If during this time the project’s Github statuses is at “pending” (CI build is still running) this will affect the “tests” score. Thus, if you do a commit as part of the publish flow (usually done as part of the version increase). It is best to first commit, wait for CI to complete, see that Github statuses are at “success” and only then publish to npmjs.com.
Next the carefulness score. The score I had was at 0.49 and this was due to the fact that I was using version 0.1.x for the package. I view the package as stable and given that CI and Coverage reporting is in place, I decided it’s time to move to version 1.0.x. After this update, the carefulness score increased to 0.99 and the total quality score increased 8 points to 90%.
Finally, I approached the branding score. The package was at a 0 branding score, as the package didn’t have any badges in the README and didn’t have a custom homepage. I decided to add 4 badges to the README: npm package version, build status (travis), coverage status (coveralls) and dependencies status (david-dm). After this final update, the branding score increased to 0.6. Even though the branding score didn’t increase to a full 1, the total quality score reached 100%, due to the way npms.io calculates the final quality score.
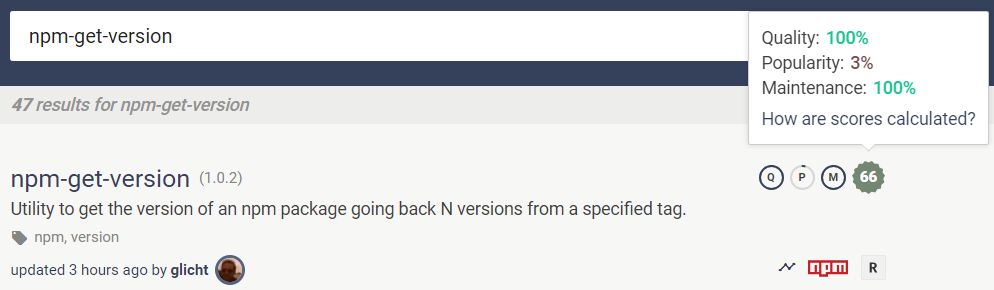
Overall, after a few simple steps I managed to increase the quality score from 76% to a full 100%. And the total score increase from 58 to 66. Not too bad for a few straight forward changes. If you want to see the exact commits of the steps taken they are all available via GitHub here.