Understanding the Force
This article was originally posted to Quora on July 2014.
One of my favorite things about D3 (other than absolutely everything), is its Layout library. It’s just so good: choose a layout (perhaps a Tree or a Chord or a Cluster), give the layout function some data, pass in some configurations, and voilà! You have all the additional information you need to render yourvisualization. All you have to do from there is to follow the good ol’ enter-update-exit pattern.
The only one that strays from this is the Force.
What does the Force layout do?
Before we delve into the deep mysteries of the Force layout, let’s first understand what it draws:
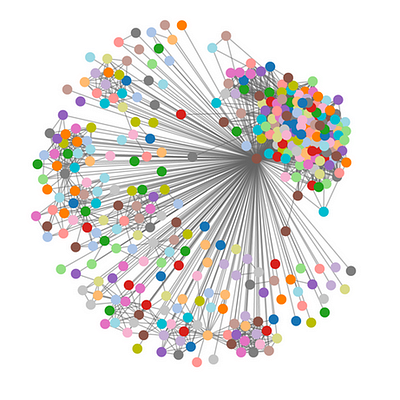
It’s a node-and-link graph. More specifically, it’s a network graph. This one in particular is a graph of my coworker’s Facebook friends, and the mutual friends she shares with each of them. When she saw her graph, she was able to identify the huge clump on the top right as her high school friends, and the smaller clusters along the top to bottom left sides as her friends from Japan, family, and past co-workers. The dataset included no information regarding her friends’ networks, but because the layout algorithm places the more interconnected nodes together, the cluster patterns implicitly emerge.
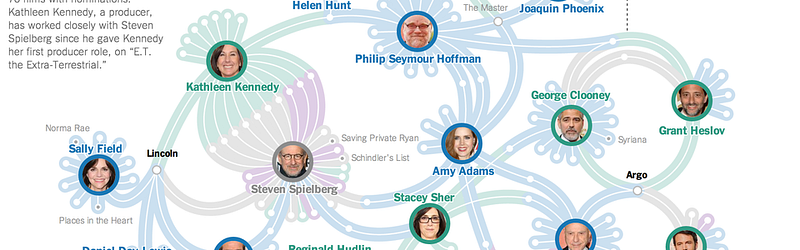
Another (much more impressive) example is that of the New York Times’ implementation showing the relationships between Oscar contenders. From the graphic, we can see that many of the nominees are interconnected, having worked on Oscar nominated works prior.
And that’s what the Force layout is really good at: offering insights on the relationships between connections. It helps us answer questions like: which of my friends know each other, and how do they know each other? How do the successful in Hollywood work with each other, and how often do they work together? How are Youtube stars interconnected?
How does it stray from the others?
As I mentioned before, with most of the layouts, you instantiate it with some configurations and then pass in data. When you pass in the data, the layout function calculates the necessary positions, and you can beautifully place the elements on the screen.
Let’s go through this with the Tree layout (full code here).
var tree = d3.layout.tree()
 .size([width, height]);
Pass in the data, which should be a JSON object starting with the root node, with each node (except the leaves) having a children array.
var data = {
 name: ‘root’,
 children: [
  {name: ‘leaf’}
 ]
};
Pass the nested data into the tree layout that we previously instantiated. This gives back a flattened array of all the node objects, with their x- and y-positions calculated. Passing in this array of nodes to the tree layout, we get back an array of all the links, with references to the source and target nodes.
var nodes = tree.nodes(data),
 links = tree.links(nodes);
We can then take the nodes array and enter all the circle elements, and take the links array and enter all the line elements. We can then position each of the nodes and links.
d3.selectAll(‘circle’)
 .data(nodes).enter().append(‘circle’)
 .attr(‘cx’, function(d) {return d.x;})
 .attr(‘cy’, function(d) {return d.y;})
 .attr(‘r’, 5);
d3.selectAll(‘line’)
 .data(links).enter().append(‘line’)
 .attr(‘x1’, function(d) {return d.source.x;})
 .attr(‘y1’, function(d) {return d.source.y;})
 .attr(‘x2’, function(d) {return d.target.x;})
 .attr(‘y2’, function(d) {return d.target.y;});
Let’s see how we would do the same things with the Force layout.
var force = d3.layout.force()
 .size([width, height]);
The data we pass in for the force layout is different from the tree layout. The force layout asks for a flat array of nodes, and a separate flat array of links. The links can either be references of the source and target nodes, or the index of those nodes in the array.
var nodes = [{name: ‘Alice’}, {name: ‘Bob’}, {name: ‘Eve’}],
 links = [{source: 0, target: 1}, {source: 2, target: 0}];
And just like before, we can pass the nodes and links array into the layout function.
force.nodes(nodes).links(links);
At this point, we’ll realize that unlike with the Tree layout, we don’t have the x- and y-positions on the node objects.
It’s because we also need to tell the force layout to start running the simulations of the forces, which nudge the nodes around at each iteration of the calculation.
force.start();
Each of these iterations are called a “tick”, and at each tick, the nodes data array is directly manipulated with the calculated x- and y-positions. D3 triggers a “tick” event at each of these iterations, and an “end” event when the simulation ends.
We can listen to either of these events, and update the node and link positions in the callback function. If we try to update the positions anywhere else, our graph wouldn’t draw, since the coordinates aren’t calculated until the simulations have started.
var node = d3.selectAll(‘circle’)
 .data(nodes).enter().append(‘circle’)
 .attr(‘r’, 5);
var link = d3.selectAll(‘line’)
 .data(links).enter().append(‘line’);
force.on(‘tick’, function() {
 node.attr(‘cx’, function(d) {return d.x;})
 .attr(‘cy’, function(d) {return d.y;});
link.attr(‘x1’, function(d) {return d.source.x;})
.attr(‘y1’, function(d) {return d.source.y;})
.attr(‘x2’, function(d) {return d.target.x;})
.attr(‘y2’, function(d) {return d.target.y;});
});Note that we want to create the elements outside of the callback function for the tick event (otherwise we would create the elements every time we went through one iteration of the simulation, which could be upwards of a thousand times), and only update the x- and y-positions within the callback function.
How does the layout work?
Force-directed graph drawing is a class of graph layout algorithms that calculate the positions of each node by simulating an attractive force between each pair of linked nodes, as well as a repulsive force between the nodes. Typically, the attractive force acts like a spring between the nodes, calculated using Hooke’s law. On the other hand, two nodes are pushed away from each other using Coulomb’s law. It is a commonly implemented graph drawing algorithm because of its flexibility and intuitiveness, as it requires no special knowledge of graph theory.
D3 implements the force-directed algorithm a little differently to give the user more control over the layout (from my understanding). It implements three primary forces upon the nodes at each tick:
- The sum of the forces acting on each node by all other nodes
- The force pushing and pulling between two linked nodes
- The force pulling each node to a focal point, usually the center of the user-defined space
While the third is self-explanatory, I want to take a moment to explain the first two forces.
First, D3 uses charge, instead of Coulomb’s law, to simulate the forces between nodes. A negative charge pushes nodes away, while a positive charge pulls nodes toward itself. To understand conceptually how charge is used, I like to think of the nodes as planets and the charges as their masses. The pull that a planet feels from another is positively correlated with the other planet’s mass, and inversely correlated with the distance between the two planets. D3 also does something extra for optimization: if a set of planets is sufficiently far from the original planet, it uses the sum of the planets’ weights as the mass and the center of mass of the planets to calculate the distance; this is also why you see a curiously large space between the large cluster of nodes on the top left and the rest of the nodes within the first network graph above.
Thus, the distance that a node is displaced depends on the charge and distance of all other nodes, and a node is nudged around based on this sum of forces at each iteration (“tick”) of the simulation.
Second, d3 does not use Hooke’s law to calculate the distance between two linked nodes. Rather, it implements a weak geometric constraint on the distance between them via the linkDistance function. At each tick, the nodes are pulled towards each other or pushed away from each other to arrive at a distance as close to the linkDistance value as possible, but defers to the charge forces already calculated. Because of this, even if a user passes in a constant for the linkDistance, the length of the links can vary.
On top of the three primary forces, there are two more concepts that affect the placement of the nodes at each tick:
- “friction”, that slows down the rate at which the node travels from its original position to its newly calculated position,
- and alpha, or the “cooling parameter”, that decrements at each tick and reduces the effect each of the forces play on the position of the nodes
These concepts exist because, if we were to position the nodes based on the above three forces at each tick and render them, the nodes would fly everywhere. To prevent this from happening, friction slows the nodes down at each tick, and alpha slows them down between each tick. After a certain threshold is reached for alpha, the force layout stops calculating, freezing the graph into what is hopefully an optimal layout.
Because the Force layout is so flashy, it is perhaps one of the most commonly misused part of the d3 library. It’s easy to copy and paste the sample code and plug in some data. But it’s capable of so much more than that, and I want to encourage exploration and experimentation with this blog post.
Just by understanding some of the forces that drive the layout, we can manipulate the layout to our own advantage. One of the best examples of this is Jim Vallandingham’s Abusing the Force talk given at the first OpenVis Conf last year. The video of his talk is well worth watching.
Some readings:
Graph drawing
Force-directed graph drawing
d3.layout.force source code
Force layout reference
A plaything:
Introduction to Network Analysis and Representation by Elijah Meeks and Maya Krishnan
I am no expert in physics or algorithms, so my understanding of the force layout may not be 100% correct. Thus, please let me know via any communication method possible for any corrections you may have — thank you!